Towards effective assessment of steady state performance in Java software: are we there yet?
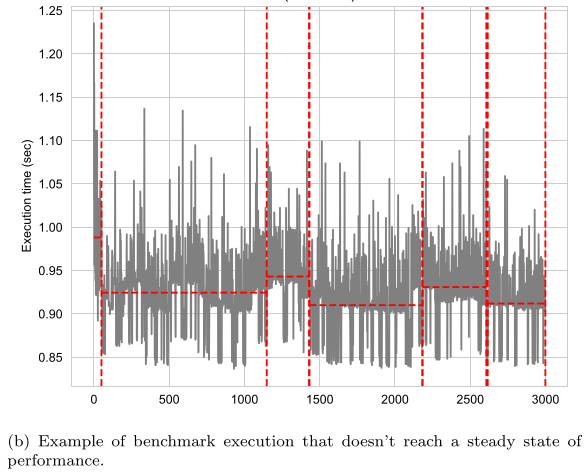 The grey line represents the execution times of each benchmark iteration visualized as a time-series. The x-axis represents the benchmark iteration number, while the y-axis represents the mean execution time within the iteration
Type
Publication
Empir. Softw. Eng.